
The Bridge | March 2026
From Spreadsheets to Stories: Mastering Data Clarity
Data is the lifeblood of a modern non-profit, but data is useless if it doesn't tell a story. Most organizations aren't suffering from a lack of information; they are drowning in it. When your dashboard has 50 different metrics, you aren't tracking progress—you’re just managing noise.
This month at Bridging Analytics, we are focusing on Dashboard Analysis & Reporting. We believe in the "3-Second Rule": if a stakeholder can’t look at your report and understand the health of a project within three seconds, the visualization has failed. It’s time to stop tracking everything and start tracking what matters.
The "3-Second Rule" for Smarter Reporting
How do you turn a mountain of spreadsheets into a narrative? Start here:
Kill the Clutter: If a metric doesn't directly influence a decision, remove it from the primary view.
Focus on the "So What?": Every chart should answer a question. Instead of "Total Donations," try "Donations vs. Monthly Goal."
Color with Purpose: Use color to highlight outliers or status (Green/Yellow/Red). Don't make the viewer hunt for the problem; show them exactly where to look.
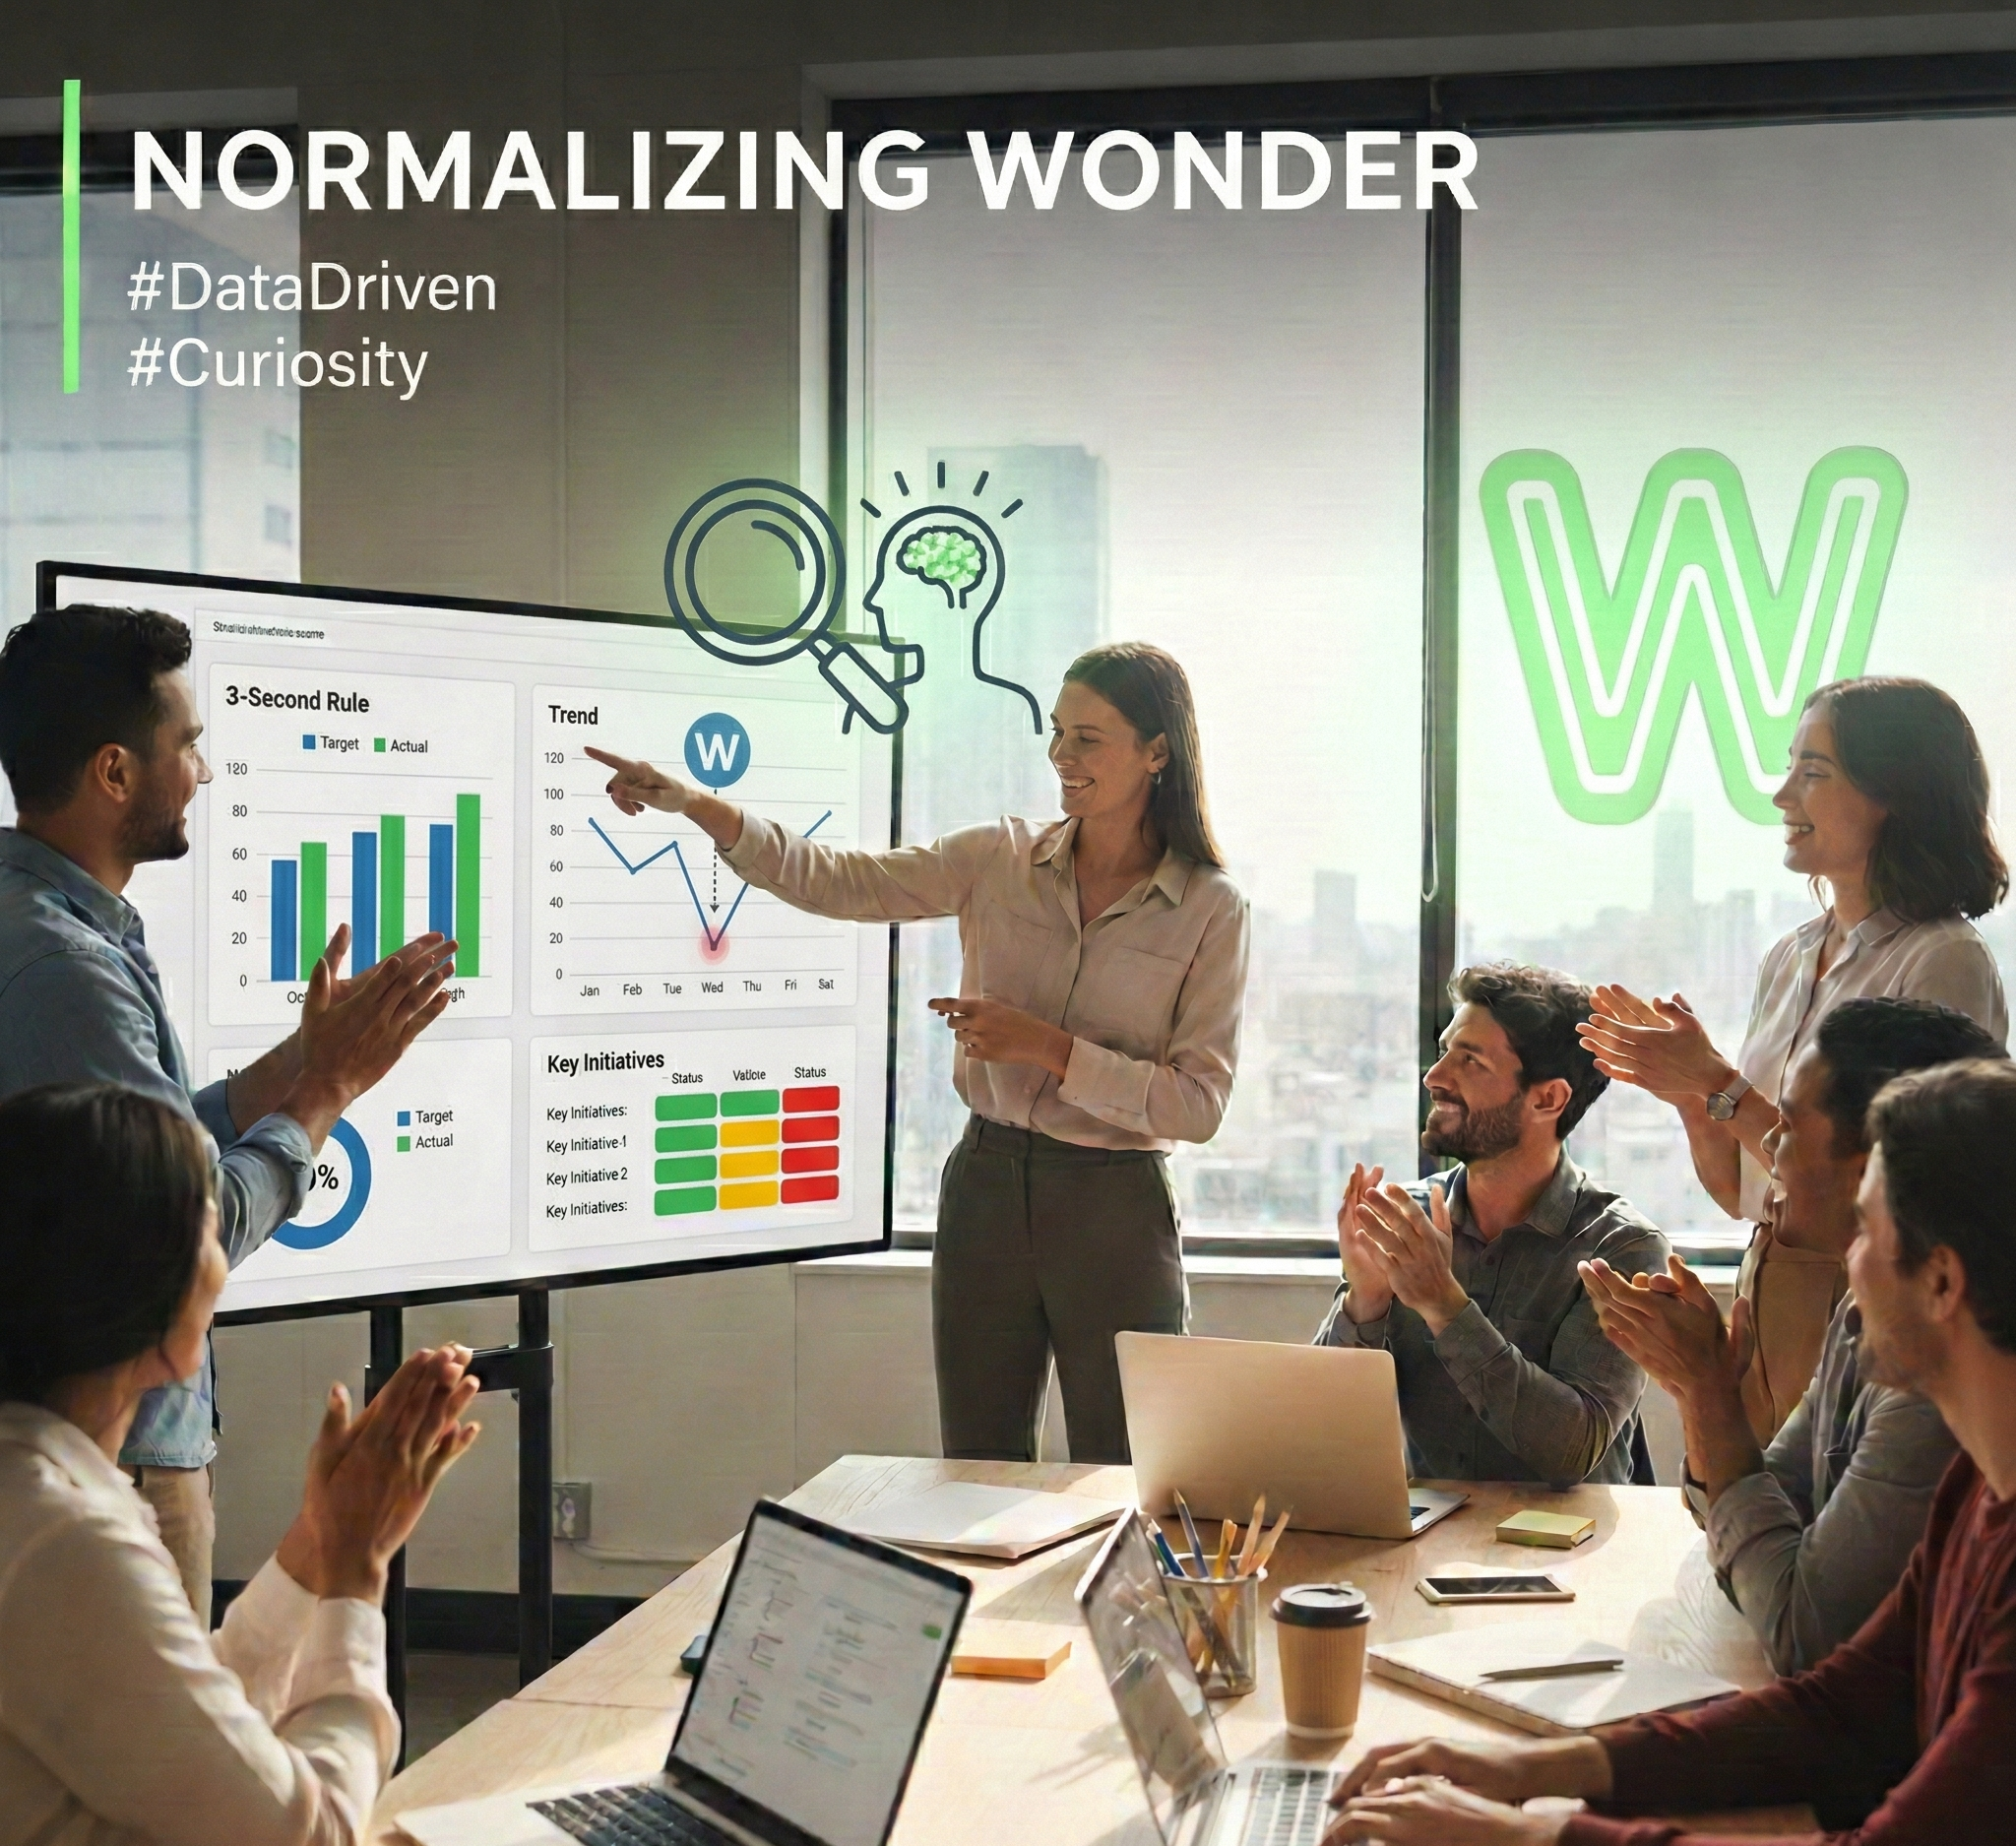
The Working Genius Corner: Normalizing Wonder (W)
How do you make data stick? By normalizing Wonder.
Data reporting often becomes a "Tenacity" task—just getting the numbers on the page and hitting send. But the most impactful leaders use data as a catalyst for curiosity. They don't just report that the numbers changed; they ask why they changed.
The Nudge: Leaders who reward curiosity over blind reporting find the insights that others miss. When you look at your dashboard this week, don't just accept the trend line. Invoke your "W" Genius. Ask: "What is this data actually telling us about our community's needs?"
Don’t just look at the chart. Ask "Why?" The best leaders are the most curious ones.
Service Spotlight: Custom Dashboard Analysis
If you had to show a board member the health of your organization in 5 minutes, could you? 📊
At Bridging Analytics, we build custom dashboards that make your impact visible at a glance. We take your messy spreadsheets and turn them into clear, actionable stories in Looker Studio or PowerBI. Stop guessing and start knowing. We help you prove your strategy is working with data that speaks for itself.
The March Reflection
True or False: I can prove my impact with data right now.
If you had to pause right now and prove to a stakeholder that your current strategy is working, would your data back you up? If the answer is "I think so" or "I need a week to pull that report," let’s talk about building a system that gives you the answer in seconds.
Let’s turn your data into your greatest advocate.